Introduction
Werkzeug is a WSGI utility library for Python. Beyond others, it includes an interactive debugger - what this means is that when your python application throws an exception, Werkzeug will display the exception stacktrace in the browser (that’s not a big deal) and allow you to write python commands interactively wherever you want in that stacktrace (that’s the important stuff).
Now, the even more important stuff is that you can abuse the above feature by adding code that will throw an exception in various parts of your application and, as a result get an interactive python prompt at specific parts of your application (for example, before validating your form, or when a method in your model is executed). All this, without the need to use a specific IDE to add breakpoints!
This is an old trick however some people don’t use it and make their work more difficult. Actually, this one of the first things I learned when starting with django and use it all the time since then - I am writing this post mainly to emphasize its usefulness and to urge more people to use it. If you don’t already use it please try it (and thank me later).
Configuration
There are two components you need to install in your django project to use the above technique:
- django-extensions: a swiss army knife toolset for django - beyond other useful tools it includes a management command (runserver_plus) to start the Werkzeug interactive debugger with your project
- werkzeug: the werkzeug utility library
Both of these can just be installed with pip (even on windows). After installing them, add django_extensions to your INSTALLED_APPS setting to enable the management command.
After that, you can just run python manage.py runserver_plus - if everything was installed successfully you should see something like this (in windows at least):
(venv) C:\progr\py\werkzeug\testdebug>python manage.py runserver_plus
 * Restarting with stat
Performing system checks...

System check identified no issues (0 silenced).

Django version 1.9.7, using settings 'testdebug.settings'
Development server is running at http://127.0.0.1:8000/
Using the Werkzeug debugger (http://werkzeug.pocoo.org/)
Quit the server with CTRL-BREAK.
 * Debugger is active!
 * Debugger pin code: 143-738-172
 * Debugger is active!
 * Debugger pin code: 174-740-467
 * Running on http://127.0.0.1:8000/ (Press CTRL+C to quit)
Now, the “debugger pin” you see is a way to protect your interactive debugger (i.e it asks for the pin before allowing you to enter the interactive prompt). Since this feature should only be used in your local development system I recommend to just disable it by setting the WERKZEUG_DEBUG_PIN environment variable to off (i.e set WERKZEUG_DEBUG_PIN=off in windows). After that you should see the message “ * Debugger pin disabled. DEBUGGER UNSECURED!“. Please be careful with the interactive debugger and never, ever use it in a production deployment even with the debug pin enabled. I also recommend to use it only on a local development server (i.e the server must be run on 127.0.0.1/local IP and not allow remote connections).
Usage
Now its time for the magic: Let’s add a django view that throws an exception, like this:
def test(request):
    a+=1
to your urls.py ( url(r'^test/', test ) ) and after you visit test you should see something like this:
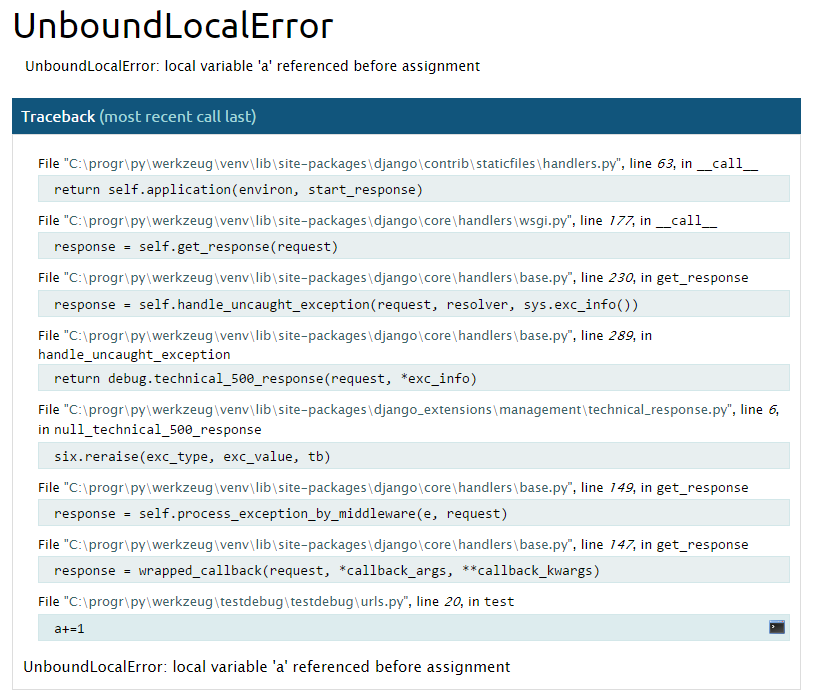
Since the a variable was not defined you’ll get an exception when you try to increaseit. Now, notice the console icon in the lower right corner - when you click it you’ll get the interactive debugger! Now you can enter python commands exactly where the a+=1 code was. For example, you can see what are the attributes of the request object you receive (for example, just enter request.GET to output the GET dictionary to the interactive console).
Notice that you can get interactive consoles wherever you want in the stacktrace, i.e I could get a console at line 147 of django.core.handlers.base module on the get_response method — this is needed sometimes especially when you want to see how your code is called by other modules.
Conclusion
As you can see, using the presented technique you can really quickly start an interactive console wherever you want and start entering commands. I use it whenever I need to write anything non trivial (or even trivial stuff - I sometimes prefer opening and interactive debugger to find out by trial and error how should I write a django ORM query than open models.py) and really miss it on other environments (Java).
The above technique should also work with few modifications with other python web frameworks so it’s not django-only.
Finally, please notice that both Werkzeug and django-extensions offer many more tools beyond the interactive debugger presented here - I encourage you to research them since - if you follow my advice - you’ll integrate these to all your django projects!